I know I can go into each site in Siteworx or each folder in /home/ to get to each site’s Apache logs. That gets awfully tedious when I’m trying to figure out what site is being attacked, causing a huge spike in httpd and mysql load on the system.
Within an hour of reboot, my load was 342. Turn httpd off and everything is fine.
You could always ssh into your server, run top to see which site is using the resource, then take action as you need by disabling that site and then look at the site stats etc…
You could always look at apache status from nodeworx system services web server and also as MySQL is involved, look at MySQL to see which site is using the processes
How would top help? BTW: top is what showed me that MySQL and httpd were using a lot of resources.
System services has a processes\clients graph for httpd, but I don’t think there’s a lot of detail there. It has how many processes, but not really what those processes are doing.
System services does say what the current commands are for MySQL, so I’ve re-enabled that domain so I can see what shows up. So far it’s the “sleep” command, but the server isn’t under a lot of load yet.
I think a centralized httpd log is critical. I could then run Fail2ban server-wide without having to spin up separate jails or an array of logfiles for the different sites. Then it’s just up to me to come up with an appropriate regex.
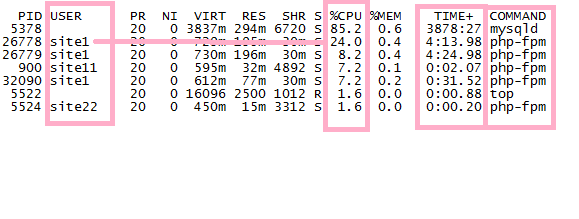
Top shows the php-fpm and unix name which greatly helps in narrowing the site. It either shows a site php taking a long time or there would be a lot of calls to the php from same site
It is only a tip which may help as it has certainly helped me in the past to very quickly identify the site, and to help further, you could kill the pid without restarting apache
If it helps to see better what I mean, please see picture. Although this is taken from top, and no site is under attack or causing issues, it shows you how quickly it can identify a site from the unix name (changed for obvious reasons), and you can see it is using php-fpm and shows cpu usage.
As I said, it is a very quick way to help narrow the search to the site causing issues, and can quickly bring httpd back into normal load by disabling the siteworx account and killing the pid’s used by the site (kill -9 pid)
Many thanks
John [ATTACH=JSON]{“data-align”:“none”,“data-size”:“medium”,“data-attachmentid”:44306}[/ATTACH]
Also,interworx would usually show as iworx or iworx-db, so it has most likely has to be httpd or root, but some of the below commands for ssh may spread a little light onto what is using httpd
I would also log into nodeworx, system services, web server, server status which should show the usage and requests taking place. This maybe the better option for you