1: Why is there a big gap in the graph? I havn’t rebooted the system and its uptime is over 4 days now. The load average did go up to about 80 at about the same as the gap, but the cron to generate the graph should still have run, right?
2: Do I have a super cpu or something? Is it even possible to have CPU usage above 100%?
The graphs won’t get updated if something is preventing the cron job from running, or preventing the cron from running to completion. My guess is with load average at 80, there was something else using all the availabe CPU, and therefore preventing the graphs from getting updated during that time.
Each graph point is a 5 minute average, and if it spikes over 100%, it means the usage over that 5 minute period had to calulate out to > 100%. This does seem strange, but all I can see is the numbers just must have worked out that way.
Hi there, all my graphs have a “missing bit” in them from yesterday. It cannot be cron not running because of CPU use, because it hasn’t been over 20%. I’m attaching a file for you to see.
I run another tool which generates other graphs for me from SQL queries and the like called NetMRG, and every so often both my Interworx graphs and the NetMRG graphs both have bits missing at the same time; as far as I can tell it’s always due to CPU load.
It could just be that the process that checks the values every X minutes crashed, and it took a couple hours for the lock file to be removed, which would then allow the process to run again from cron.
 [/size]
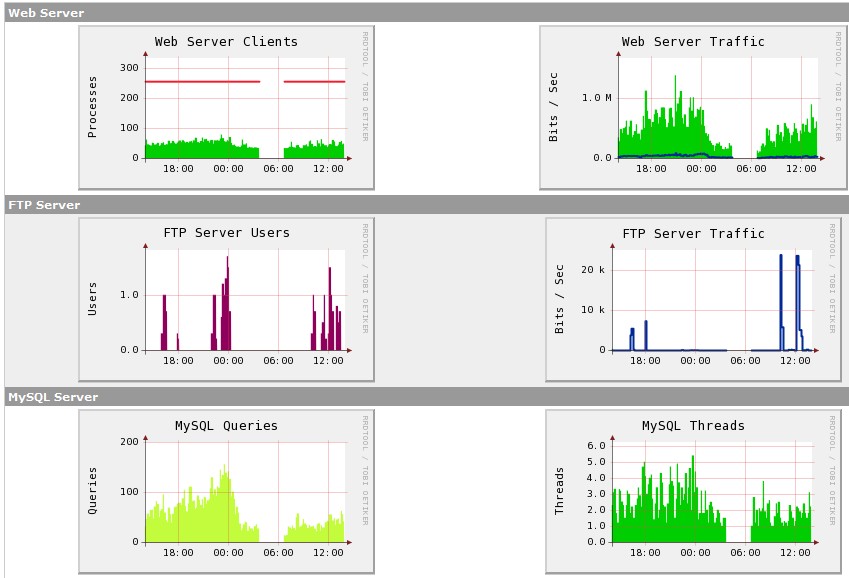